For the state to invest in the building blocks of thriving communities — schools, health care, public safety, roads, parks, and other public services — we need a fair and adequate tax system. The type of tax system we need should provide enough revenue to maintain public services and also divide up the responsibility for funding these services according to a household’s ability to pay. Unfortunately, our tax system fails in apportioning responsibility equitably.
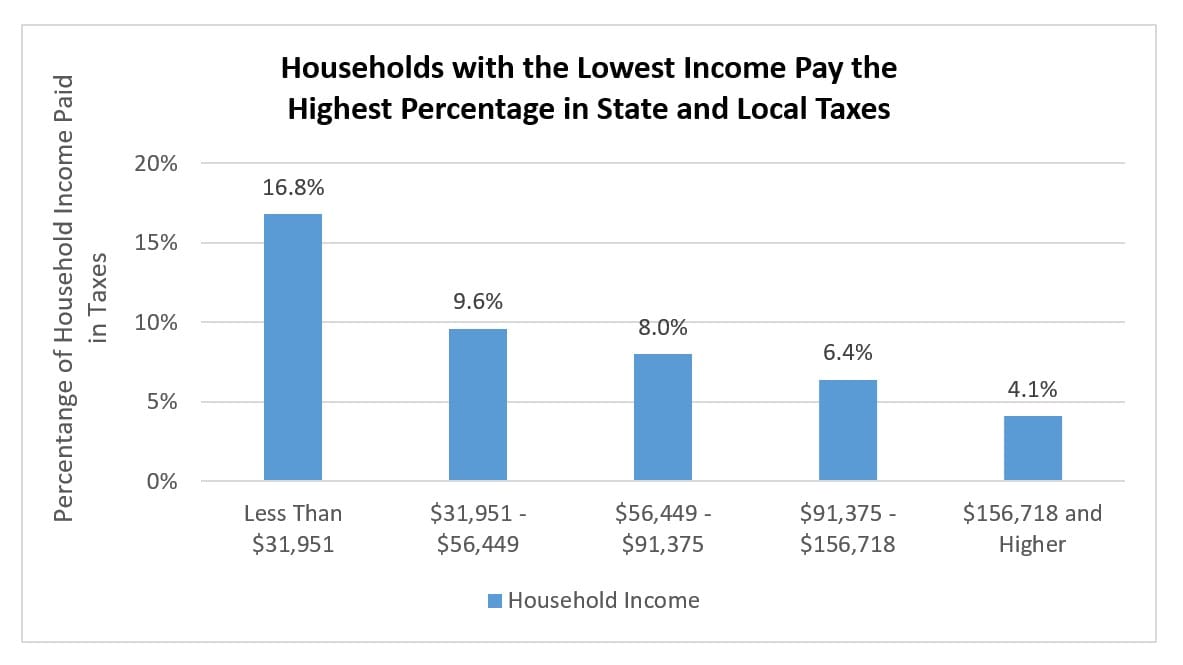
Our state’s tax system is upside down, asking the most from those with the least. In Texas, the wealthiest residents pay an average of 4.1 percent of their income in state and local taxes, compared to 16.8 percent for residents with the lowest incomes.
The unfairness of a tax system is measured by a “tax incidence analysis,” which evaluates the impact of various taxes on residents at different income levels. The Texas Comptroller is required to conduct that type of analysis every two years. The newest Tax Exemptions and Tax Incidence report demonstrates conclusively that low- and moderate-income Texas households bear a disproportionate share of state and local taxes*.
Texas households that are the least able to afford it pay the most in taxes as a percentage of their income, while the Texas households that can afford to pay more pay the least.
Tax Fairness
One way to judge the fairness of a tax system is to compare the percentage of income that different households pay in taxes. The Comptroller’s study ranks Texas households according to income, from highest to lowest, then combines them into five groups (called “quintiles”), each of which contains the same number of households. In a state with a fair tax system, the taxes that each income group paid have similar percentages of household income. However, in Texas, the households with the lowest incomes pay the highest percentage of their income in taxes and the households with the highest incomes pay the lowest percentage of their income in taxes.
The graph below, derived from the information in the Comptroller’s report, shows the range of incomes of households in each group and the average percentage of total household income paid in state and local taxes. Each group contains one-fifth (20 percent) of all Texas households, or about 2 million households. The graph reveals that households with income less than $31,951 pay more than four times more in taxes as a percentage of income than households with income over $156,718.
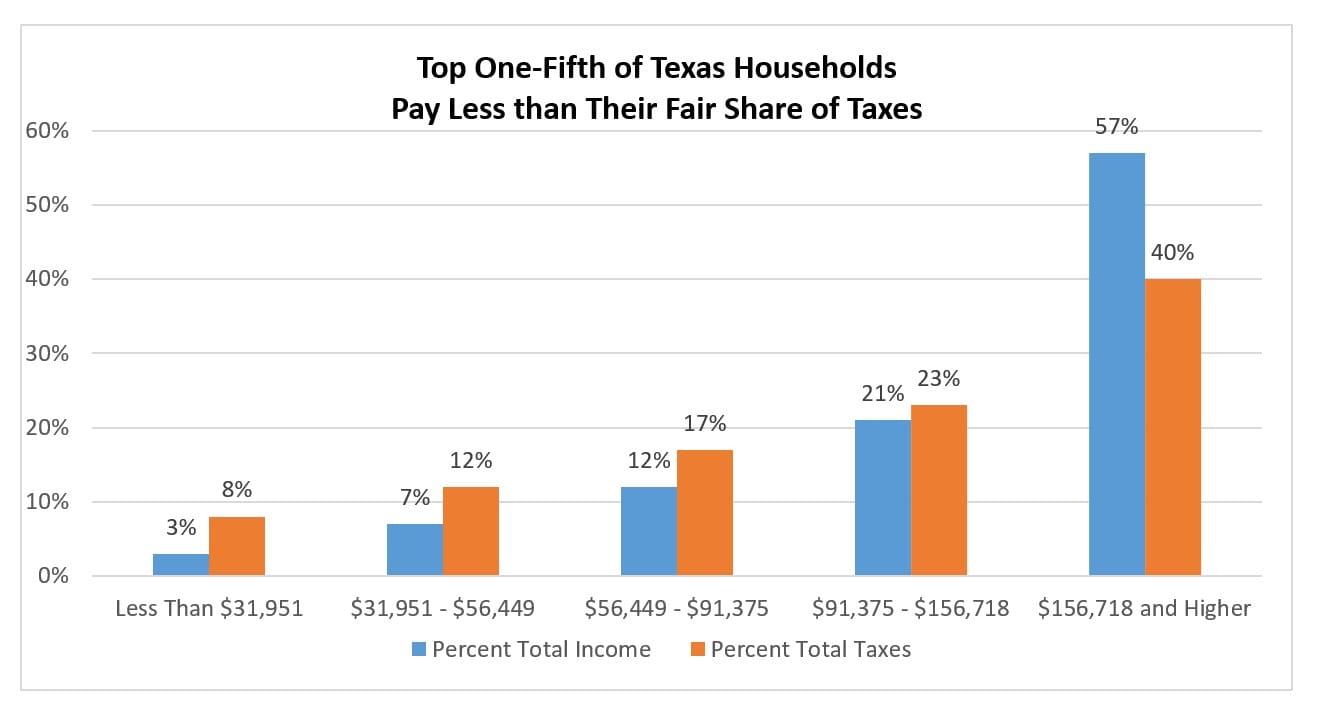
Another way to measure the fairness of a tax system is to compare the income received by households in each income group to the taxes paid by these households. The graph shows that, for each of the four income groups (80 percent of Texas households) earning less than $156,718 per year, the share of taxes paid by that group is higher than the share of income received by households in that group. This disparity enables the top one-fifth of Texas earners to pay a much smaller share of taxes than the share of income they receive.
Tax Incidence
Although businesses and households may initially pay taxes, incidence studies reflect that businesses shift their tax cost onto workers through lower wages, onto consumers through higher prices, and onto shareholders through lower profits. The Comptroller calculates both the initial distribution of tax by industry and the final incidence of tax by household income.
For instance, all households pay property taxes. Homeowners pay their property taxes directly, while renters pay property taxes indirectly. Landlords initially pay the taxes on the property and then pass the cost of the taxes onto their tenants through higher rents. The degree to which landlords can pass on these taxes varies with the local rental market.
Which Tax Is the Fairest?
The Suits Index measures the fairness of a tax system by mathematically comparing the percentage of taxes paid and the percentage of total income received for each taxpayer. If each family paid the same percentage of income in tax, the Suits Index for that tax would be zero. When a tax code is upside down, asking more of those with the least, it’s called “regressive” — the upside-down taxes score less than zero on the Suits Index. All major Texas taxes score lower than zero — each puts more responsibility on those with the least. As of October 2018, the Texas state and local tax system was the second worst offender of the 50 states when it comes to putting more responsibility on those with the least.
Tax Suits Index (from most fair to least fair)
| Oil Production Tax | -0.041 (most fair) |
| Franchise Tax | -0.083 |
| School Property Tax | -0.113 |
| Motor Vehicle Sales Tax | -0.216 |
| Sales Tax | -0.241 |
| Gasoline Tax | -0.267 |
| Insurance Premiums | -0.282 (least fair) |
The relative fairness of different taxes varies significantly. The oil production tax is actually the fairest major tax paid by Texans, because it ranks closest to 0. Meanwhile the gasoline and insurance premium taxes are the least fair.
The index also demonstrates that the sales tax, which accounts for over half of all state tax revenue, is one of the most unfair taxes. The sales tax responsibility falls more on low-income families than on higher-income families, since it is based on how much each family spends. Low-income families typically spend three quarters of their income on goods subject to the sales tax. Middle-class families spend less than half of their income on items subject to sales tax. And the richest families spend one quarter or less of their income on sales-taxable items. Exemptions for groceries, residential utilities (gas, electric, and water), and prescription and over-the-counter medicines reduce the unfairness of the sales tax somewhat. Taxing currently untaxed business and professional services primarily used by higher-income families could also reduce the inequity of the sales tax.
The school property tax takes a more equitable percentage of income from families at every income level. This may be because families at most income levels spend similar percentages of their income on housing. In addition, business owners who generally make more income frequently bear the responsibility for business property taxes. The homestead exemption, which is currently $25,000, and the 65-and-over tax ceiling reduce school property taxes, particularly for lower-income homeowners.
Another method of introducing consideration of a homeowner’s ability to pay property taxes is a “circuit breaker” program, which reduces property taxes that exceed a certain percentage of a taxpayer’s income. Without a circuit breaker, the property taxes owed on a home can rise, even when a homeowner’s income does not. Circuit breakers can be targeted to taxpayers most responsible for property taxes, reducing their tax liability to a manageable level. Because of this careful focus, circuit breaker programs cost much less than across-the-board rate reductions or increases in exemptions.
Some Non-Texans Pay Texas Taxes
Certain Texas taxes are passed on to non-Texans, primarily through higher prices. For instance, as shown below, close to two-thirds of the oil production tax is exported, so that the final incidence is not borne by in-state households. This is because much of the oil produced in Texas is processed here but sold out of state. Similarly, out-of-state consumers or shareholders end up paying more than one-third of the franchise tax that Texas businesses initially pay.
Tax Percent Paid By Non-Texans
| Oil Production | 64.4% |
| Franchise | 36.0% |
| School property | 21.6% |
| Sales | 20.7% |
| Gasoline | 11.0% |
| Insurance premium | 9.9% |
| Motor vehicle sales | 7.8% |
Conclusion
The Texas tax system remains unfair, since those who can pay more in taxes as a percentage of income do not pay more. Without a fair and adequate tax system, the state’s ability to invest in schools, public safety, roads, and other public services will continually become more difficult.
Click here for more on who does not pay Texas taxes.
The Texas Exemptions and Tax Incidence report is available here.
* Per Section 403.0141 of the Texas Government Code, incidence analysis is conducted for the school property tax and any taxes that generate more than 2.5% of state tax revenue in the previous fiscal year. More information here.