In 2019, the Texas Legislature passed House Bill 3 (HB 3) — an $11.6 billion school finance reform law that dedicated over $6 billion toward investments in education and $5 billion toward replacing school property taxes with state aid. The property tax cut portion of HB 3 is set to expand each year, costing the state more money annually without sending any additional funding into classrooms.
While HB 3 makes an ongoing financial commitment to property tax cuts, no similar promises are made to the children of Texas to keep pace with rising future education costs, reform special education funding, or improve funding for the 80 percent of English learners[1] left behind in HB 3.
Most concerning is the elimination of the fundamental tax equity principle that school districts must receive similar revenue for similar tax effort, which is measured in school property tax rates. The largest portion of the total school district tax rate is now based on the amount of property value growth within the district, rather than everyone taxing at the same unified rate. School districts with high property value growth will see rates plummet while those with slower growth will see their rates remain stagnant. Because all districts will still be entitled to similar levels of revenue for that portion of the property tax, regardless of tax rate, the state is now requiring school districts with less robust economic growth to subsidize lower tax rates for school districts seeing the fastest economic growth.
The costly property tax cuts in HB 3 will put a strain on the state’s 2022-2023 budget and limit resources available for keeping school funding whole as our districts work through the COVID-19 crisis and accompanying instability in enrollment and attendance. The first priority of the 2021 Legislature should be to ensure our schools have stable funding throughout this school year and the coming biennium, and add any additional resources needed to combat losses of learning and pivots in service delivery. To accomplish this, the Legislature should freeze the costly and inequitable property tax cuts for the biennium and put our students first.
The connection between property taxes and funding public schools
Funding for Texas schools comes from state revenue and local property tax collections. Each school district’s demographics are run through a complex set of formulas to determine the set amount of funding that school receives for operations. Revenue collected from property taxes is used first to meet the set funding amount. If a district is unable to generate all its funding locally, the state provides aid. Districts that collect local revenue beyond the state’s set amount send the excess back to the state for redistribution to other districts and charter schools – this is known as recapture.
Prior to HB 3, when local economies were strong, property tax collections increased, and the state was able to reduce its contribution to schools while ensuring that schools still received the promised amount of state/local total revenue. The school finance system therefore allowed the state to take advantage of higher local property value growth, which state budget writers plan for in their funding projections. As a result, the state’s share of school funding would decline each year.
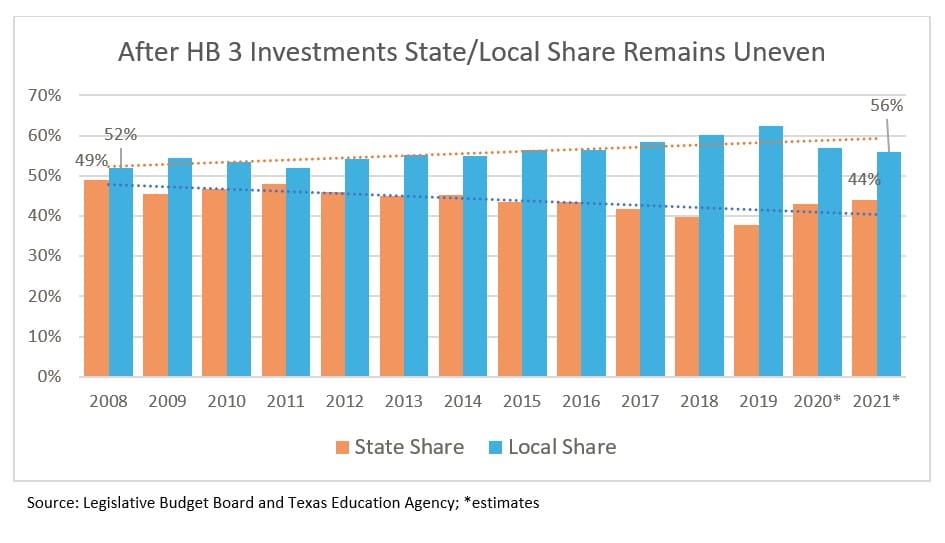
In a radical change, under HB 3, the state does not fully reduce its contribution to schools when property tax revenues increase. Instead, school districts must decrease their local tax rates once they hit a certain level of property value growth, resulting in fewer local property tax dollars collected. To ensure schools receive the same level of funding, the state will need to dedicate more state dollars to public education, mainly general revenue dollars that come from the sales tax.
This change shifts where school funding comes from but does not increase the amount of funding for schools. Even with an $11.6 billion total investment from HB 3, the state share is estimated to rise to only 44 percent in 2021,[2] below the historical high 49 percent in 2008. Without a new source of revenue to replace lost property tax collections, the state’s already inadequate revenue system will be further strained, and new investments in education will be difficult to make.
HB 3 reduces the Tier I Maintenance & Operation portion of the school property tax though both a Statewide Tax Rate Compression and an Individual School District Tax Rate Compression. Tier I is the largest portion of the M&O school property tax — it generates the money needed to run schools, pay teacher salaries, cover the cost of utilities, and provide a base level of education.
Statewide Tax Rate Compression
Prior to HB 3, school districts taxed property owners at a rate of $1.00 per $100 of property value to generate the money needed to run schools. This is referred to as the Tier I M&O tax rate. At the tax rate of $1.00 per $100 of property value, for example, the owner of a house with a taxable value of $200,000 pays $2,000 for this portion of the M&O tax for local schools.
HB 3 required all school districts to reduce Tier I M&O tax rates to $0.93 per $100 of property value from $1.00 per $100 of property value in fiscal year 2020.
Future compression is based on the extent to which statewide property value growth estimates exceed 2.5 percent. The Legislature sets statewide property value growth estimates in the General Appropriations Act, the state budget. The higher the Legislature estimates property values will grow, the greater the tax rate compression will be. For 2020, the estimated property value growth was 4.01% resulting in a statewide compressed tax rate of $0.9164 per $100 of property value for fiscal year 2021.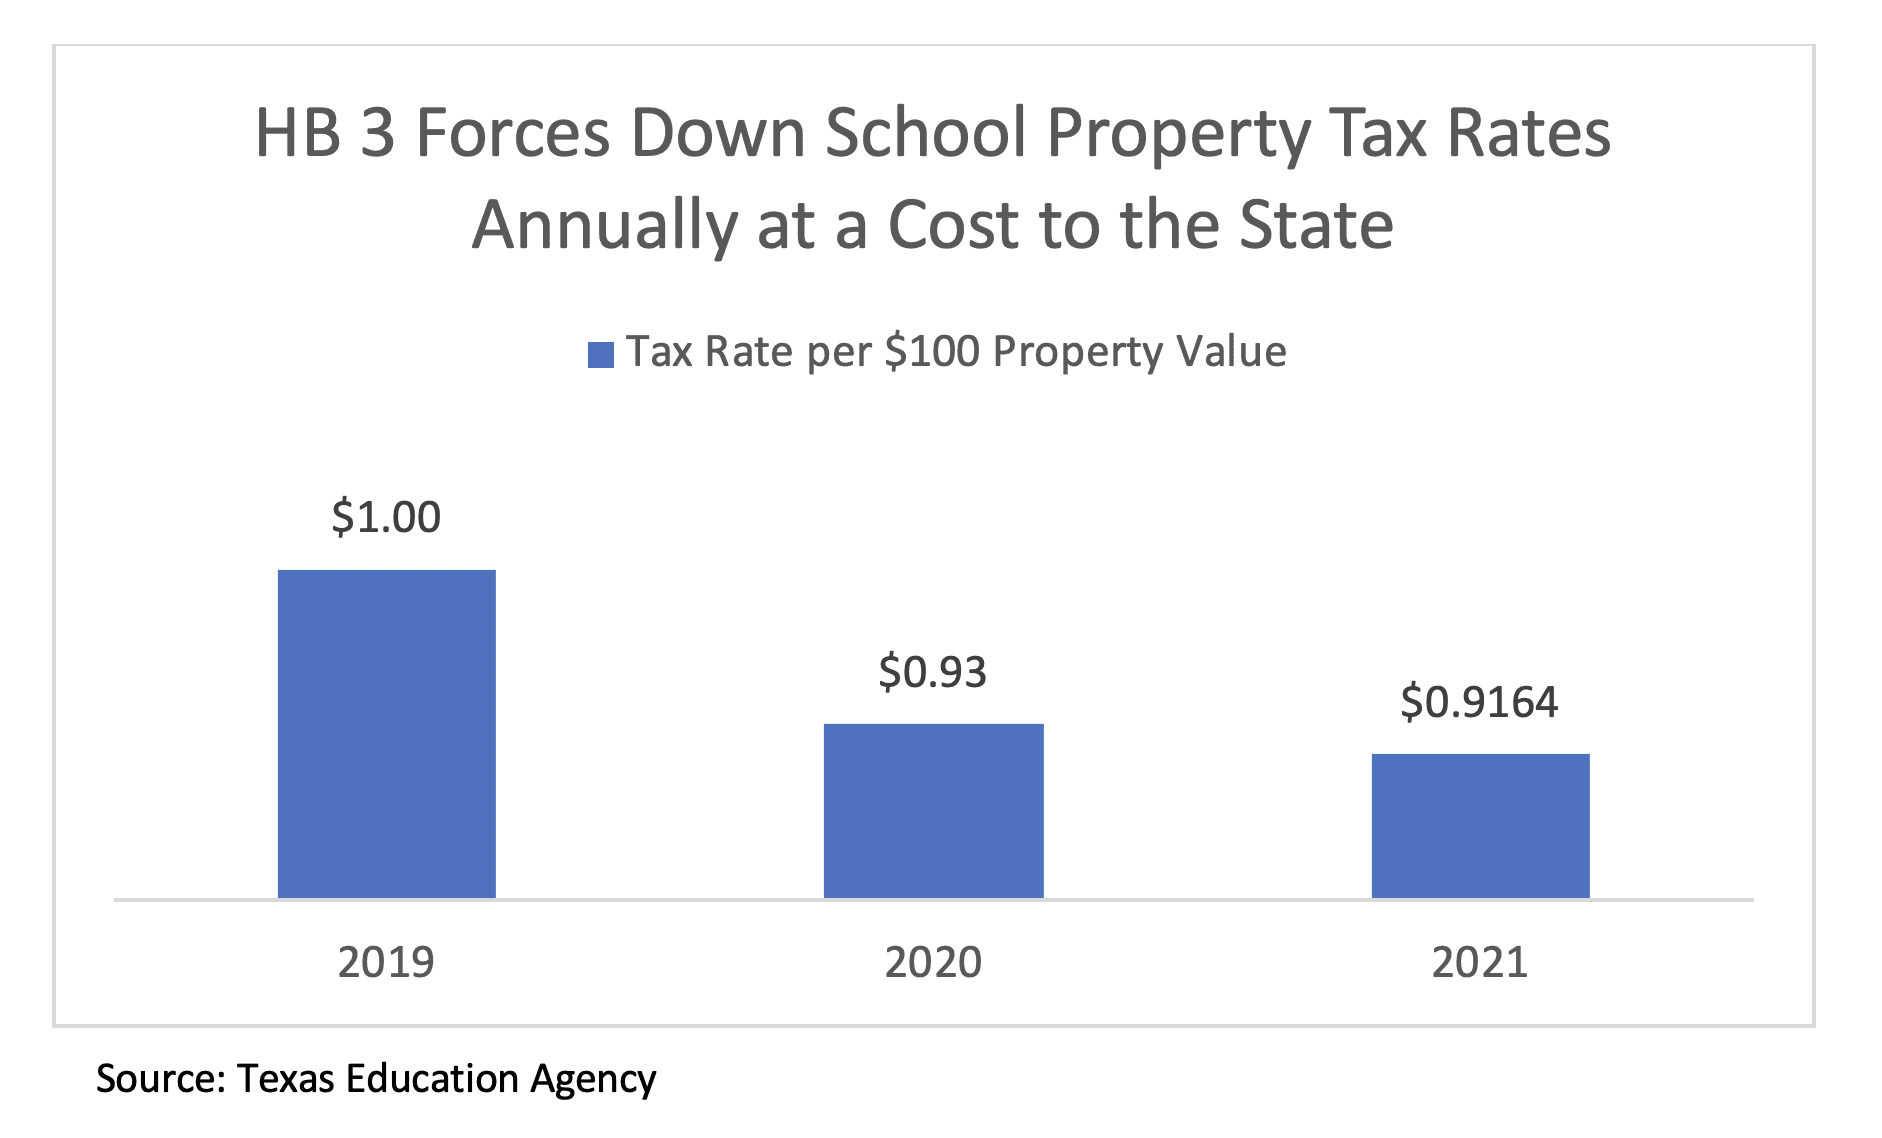
Going forward, HB 3 will cut even further into the Tier I M&O rate as property values grow statewide. Every time the M&O tax rate drops, the state must come up with additional state funding to replace the lost local property tax revenue. This will continue until the Tier I M&O tax is eliminated.
The legislature should freeze the statewide compressed tax rate at $0.9164 until the budget recovers from the COVID-19 related downturn and an alternative revenue source is identified to make up for lost property tax revenue.
Individual School District Tax Rate Compression
In addition to the statewide tax rate compression, school districts are required to reduce tax rates at the local level when property value growth exceeds 2.5%. Since the statewide compressed tax rate is highest any district can tax, a district must see value growth above 4.01% to see additional compression.
The Texas school finance system is based on the tax equity principle, upheld repeatedly by the courts, that all school districts must have access to similar levels of revenue for similar tax effort. Every child in Texas is guaranteed the same level of education, so it is important that all communities put the same effort (measured by tax rates, in this case) into supporting public education. The state’s role was to equalize funding between property-poor and property-wealthy districts with state aid and recapture.
It is not unusual to see large disparities in per-student property wealth between neighboring districts, based on historic discrimination in establishing school district boundaries. For example, in San Antonio, Alamo Heights Independent School District has over $1.5 million in property value per student to tax from, while Edgewood ISD has less than $200,000 in property value per student.[3] These wealth disparities are often the result of the formal and informal racial and economic segregation that has shaped communities over time, especially in urban and suburban areas. A recent analysis by Vox shows how public officials drew school districts and attendance boundaries to perpetuate residential segregation.[4]
In a radical change, HB 3 abandons the principle of “equal revenue for equal tax effort” and shifts to a taxing system based purely on the rate of property value growth within the school district. Districts seeing the fastest economic growth will experience the greatest declines in property tax rates at the expense of districts with less growth, ultimately creating new divisions between high-taxing and low-taxing school districts.
New Divisions Between School Districts
Instead of all school districts taxing at the same Tier I M&O tax rate to generate similar levels of funding, tax rates currently range from $0.8247 per $100 of property value to $0.9164 — a gap of $0.0917 between the highest and lowest taxing district.[5] HB 3 allows the inequity in rates to grow to a maximum of 10 percent.
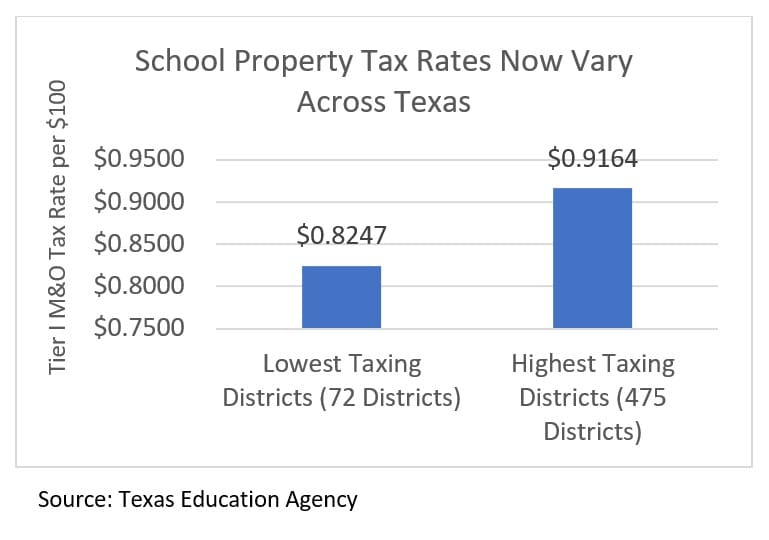
The lowest taxing districts represent 7 percent of all taxing school districts and 2 percent of all students enrolled in taxing school districts. In contrast, the highest taxing districts represent 47 percent of taxing districts and 39 percent of all students in taxing districts. Fifty-four percent of students in the lowest taxing districts are economically disadvantaged, while 64 percent are economically disadvantaged in the highest taxing districts.[6]
Because property value growth determines tax rates, divisions between districts based on property wealth are not as immediately apparent. The average Tier I M&O tax rate for property-wealthy school districts in recapture, those that return excess revenue above formula amounts to the state, is $0.8976 per $100 of property value. That is just slightly more than the average rate of $0.8905 for a non-recapture district.
When a recapture district reduces its tax rate, its recapture payment goes down because it collects less money. The state must make up for those lost recapture dollars. When a non-recapture district sees its rates decrease it too collects less revenue and the state fills the gap. In both scenarios the cost of education for the state goes up, but kids in classrooms do not benefit.
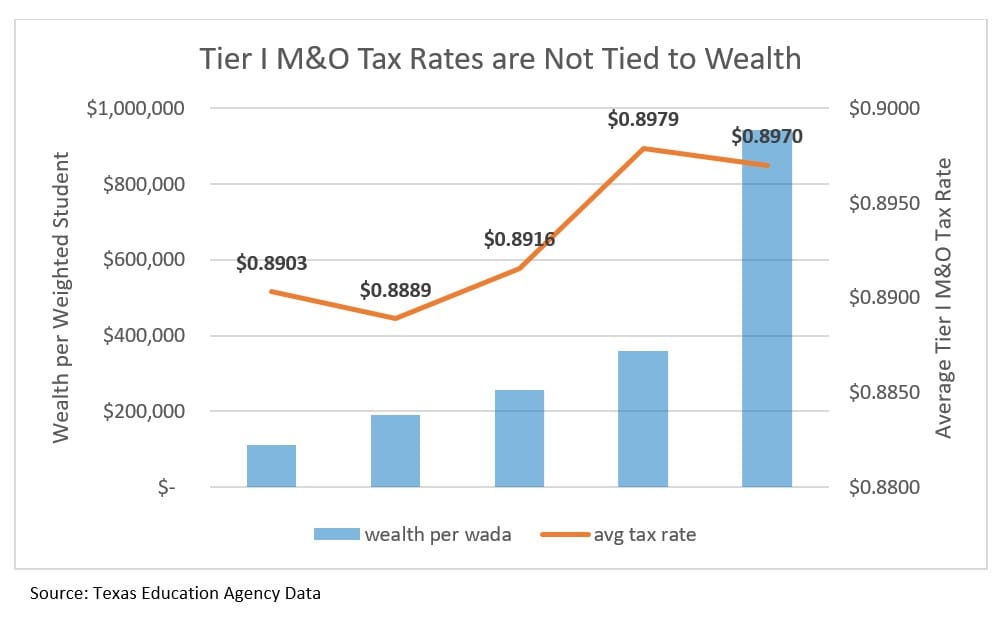
When you look at Tier I M&O tax rates by wealth per weighted student, on average districts with the lowest property wealth per student are taxing at lower rates than the wealthiest districts in the state.[7]
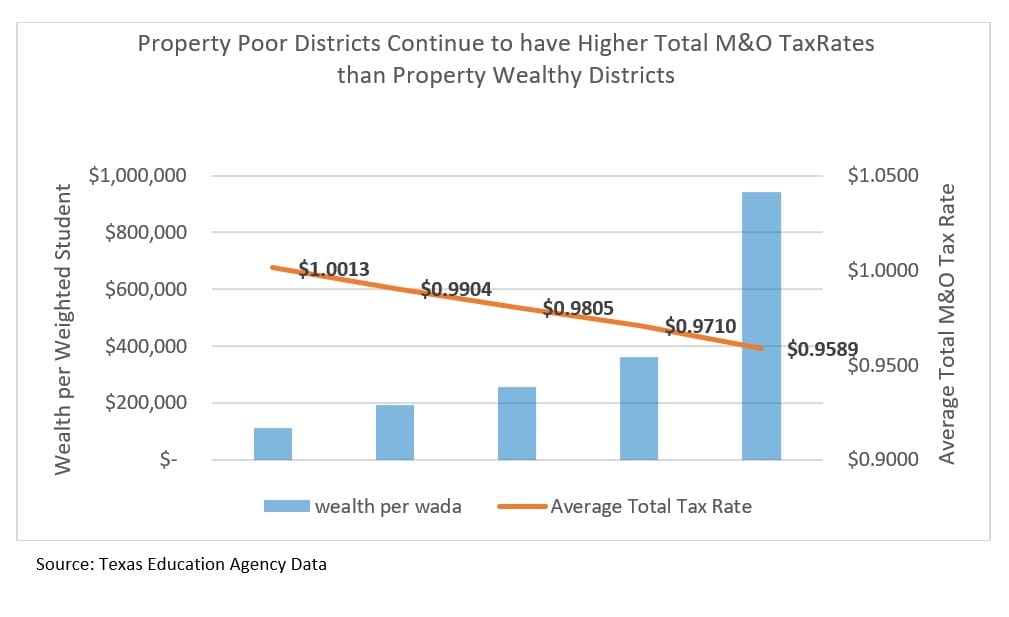
However, when you factor in the Tier II M&O tax rate, you see that property-poor districts still must tax at higher rates to compete with property-wealthy districts.[8] Tier II of the school finance system is supposed to provide districts the discretion to generate additional funding to expand on basic educational offerings. However, due to overall inadequate and arbitrary school funding levels, most districts rely on Tier II funding just to make ends meet. Most of Tier II funding is based on district property wealth, allowing wealthy districts to keep total M&O tax rates low, even with higher average Tier I rates.
The starkest divisions in Tier I M&O tax rates can be seen between different types of communities.[9] Because the tax rate is based on property value growth, it is not surprising that non-metropolitan fast growth districts on average have the lowest tax rate compared to any other community type. The Texas Education Agency classifies these districts as having seen enrollment increases of 20 percent or more over five years, and at least 300 students enrolled that represent less than 75 percent of students in the county.[10] These communities are growing by adding new businesses, housing, and other development — that growth is reflected in property value appraisals.
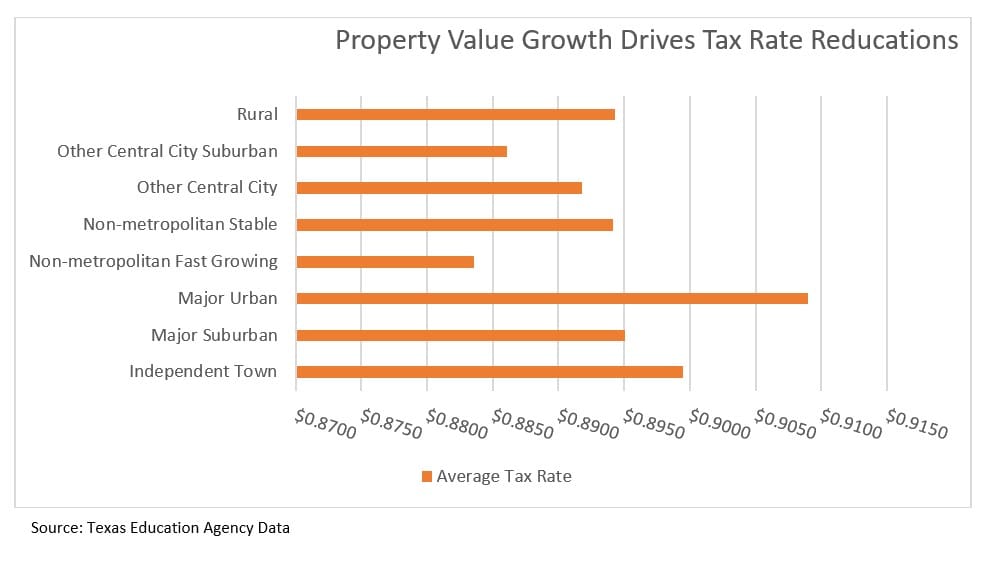
While the large urban districts in Texas are generally property-wealthy, they did not experience the same rate of growth as other community types. Part of this slower reported growth in property values may be due to decisions made by local appraisal boards reacting to COVID-19 uncertainty.
Due to their growth and overall prosperity, non-metropolitan fast growth districts enjoy lower tax rates, even though only 44 percent of their students are economically disadvantaged, compared to 73 percent economically disadvantaged in the big urban districts.[11] This means families with lower incomes are subsidizing low tax rates for their more affluent neighbors.
For example, Melissa ISD, a non-metropolitan fast growth district in Collin County has a Tier I M&O tax rate of $0.8247 with only 8% of students identified as economically disadvantaged. While McKinney ISD, also in Collin County, has a tax rate of $0.9164 and 32% of students are economically disadvantaged. Even though these two school districts are in the same county, one is taxing at the maximum allowed rate while the other is taxing at the minimum.
The legislature should abandon individual district compression before it harms local economies and restore the principle of similar revenue for similar tax effort by bringing all districts back to a unified Tier I M&O tax rate.
Tax Compression Puts Kids Last
While HB 3 contained some long overdue renovations for the school finance system, most of those additions were one-time investments without any promises to fix the forgotten parts or keep funding up to date going forward. The true legacy of HB 3 is the slow elimination of the Tier I M&O property tax without a plan to pay for it. Tax rate compression is expensive, strains an already tight budget, and puts the children of Texas last.
Endnotes
[1] Texas Education Agency. English Learners by Program, 2018-2019.
[2] Texas Education Agency. Report on Public Education State Funding Transparency General Appropriations Act, 2020-21 Biennium, Article III, Page III-1 (Rider 67); Dec. 2019. https://tea.texas.gov/sites/default/files/rider67-charts.pdf
[3] Texas Education Agency. Wealth per Average Daily Attendance Report; 2019-2020. https://tea.texas.gov/finance-and-grants/state-funding/state-funding-reports-and-data/average-daily-attendance-and-wealth-per-average-daily-attendance
[4] Chang, Alvin. We can draw school zones to make classrooms less segregated. This is how your district does. Vox; 2018. https://www.vox.com/2018/1/8/16822374/school-segregation-gerrymander-map
[5] Texas Education Agency. Tax Year 2020 Final Maximum Compressed Tax Rate; August 31, 2020. https://tea.texas.gov/sites/default/files/school-year-final-mcr.pdf
[6] Every Texan analysis of Texas Education Agency 2018-2019 Snapshot Data and Tax Year 2020 Final Maximum Compressed Tax Rate; Dec. 2020.
[7] Every Texan analysis of Texas Education Agency Wealth per WADA Report, 2019-2020 School Year and Tax Year 2020 Final Maximum Compressed Tax Rate; Dec. 2020.
[8] Every Texan analysis of Texas Education Agency Wealth per WADA Report, 2019-2020 School Year and Tax Year 2020 Final Maximum Compressed Tax Rate; Dec. 2020.
[9] Every Texan analysis of Texas Education Agency 2018-2019 Snapshot Data, Tax Year 2020 Final Maximum Compressed Tax Rate, and State Aid Template 2020 and 2021 Biennium Data; Dec. 2020.
[10] Texas Education Agency. District Type Glossary of Terms, 2018-2019. https://tea.texas.gov/reports-and-data/school-data/district-type-data-search/district-type-glossary-of-terms-2018-19
[11] Every Texan analysis of Texas Education Agency 2018-2019 Snapshot Data and Tax Year 2020 Final Maximum Compressed Tax Rate; Dec. 2020.