View this blog as a PDF here. This is an updated version of our biennial report on the state and local tax systems. View the previous version of this report here.
Learn about who does not pay Texas taxes here.
Taxes support the essential public services that we all need, whether we are Black, brown, or white, and wherever we live in Texas, so that we can all thrive. For the state to invest in the building blocks of thriving communities — schools, health care, public safety, roads, parks, and other public services — we need a fair and adequate tax system. Our state’s tax system should provide enough revenue to maintain public services and divide up the responsibility for funding these services according to a household’s ability to pay. Unfortunately, our tax system fails in apportioning responsibility equitably.
Our current tax system is upside down, asking the most from those with the least. In Texas, the wealthiest residents pay an average of 4.75% of their income in state and local taxes, compared to nearly 17% for residents with the lowest incomes.
The unfairness of a tax system is measured by a “tax incidence analysis,” which evaluates the impact of various taxes on residents at different income levels. The Texas Comptroller is required to conduct that type of analysis every two years. The newest Tax Exemptions and Tax Incidence report demonstrates conclusively that low- and moderate-income Texas households bear a disproportionate share of state and local taxes.*
Put simply, Texas households that are the least able to afford it pay the most in taxes as a percentage of their income, while the Texas households that can afford to pay more pay the least.
Tax Incidence
Although businesses and households may initially pay taxes, incidence studies reflect that businesses shift their tax cost onto workers through lower wages, onto consumers through higher prices, and onto shareholders through lower profits. The comptroller calculates both the initial distribution of tax by industry and the final incidence of tax by household income.
For instance, all households pay property taxes. Homeowners pay their property taxes directly, while renters pay property taxes indirectly. Landlords initially pay the taxes on the property and then pass the cost of the taxes onto their tenants through higher rents. The degree to which landlords can pass on these taxes varies with the local rental market.
The comptroller calculates the incidence for the school property tax and state sales tax, as well as for the motor-vehicle sales, franchise, and oil and gas production taxes. Local sales taxes and property taxes are not included in the study, although the incidence of these local taxes closely resembles the incidence of similar state taxes.
Tax Fairness
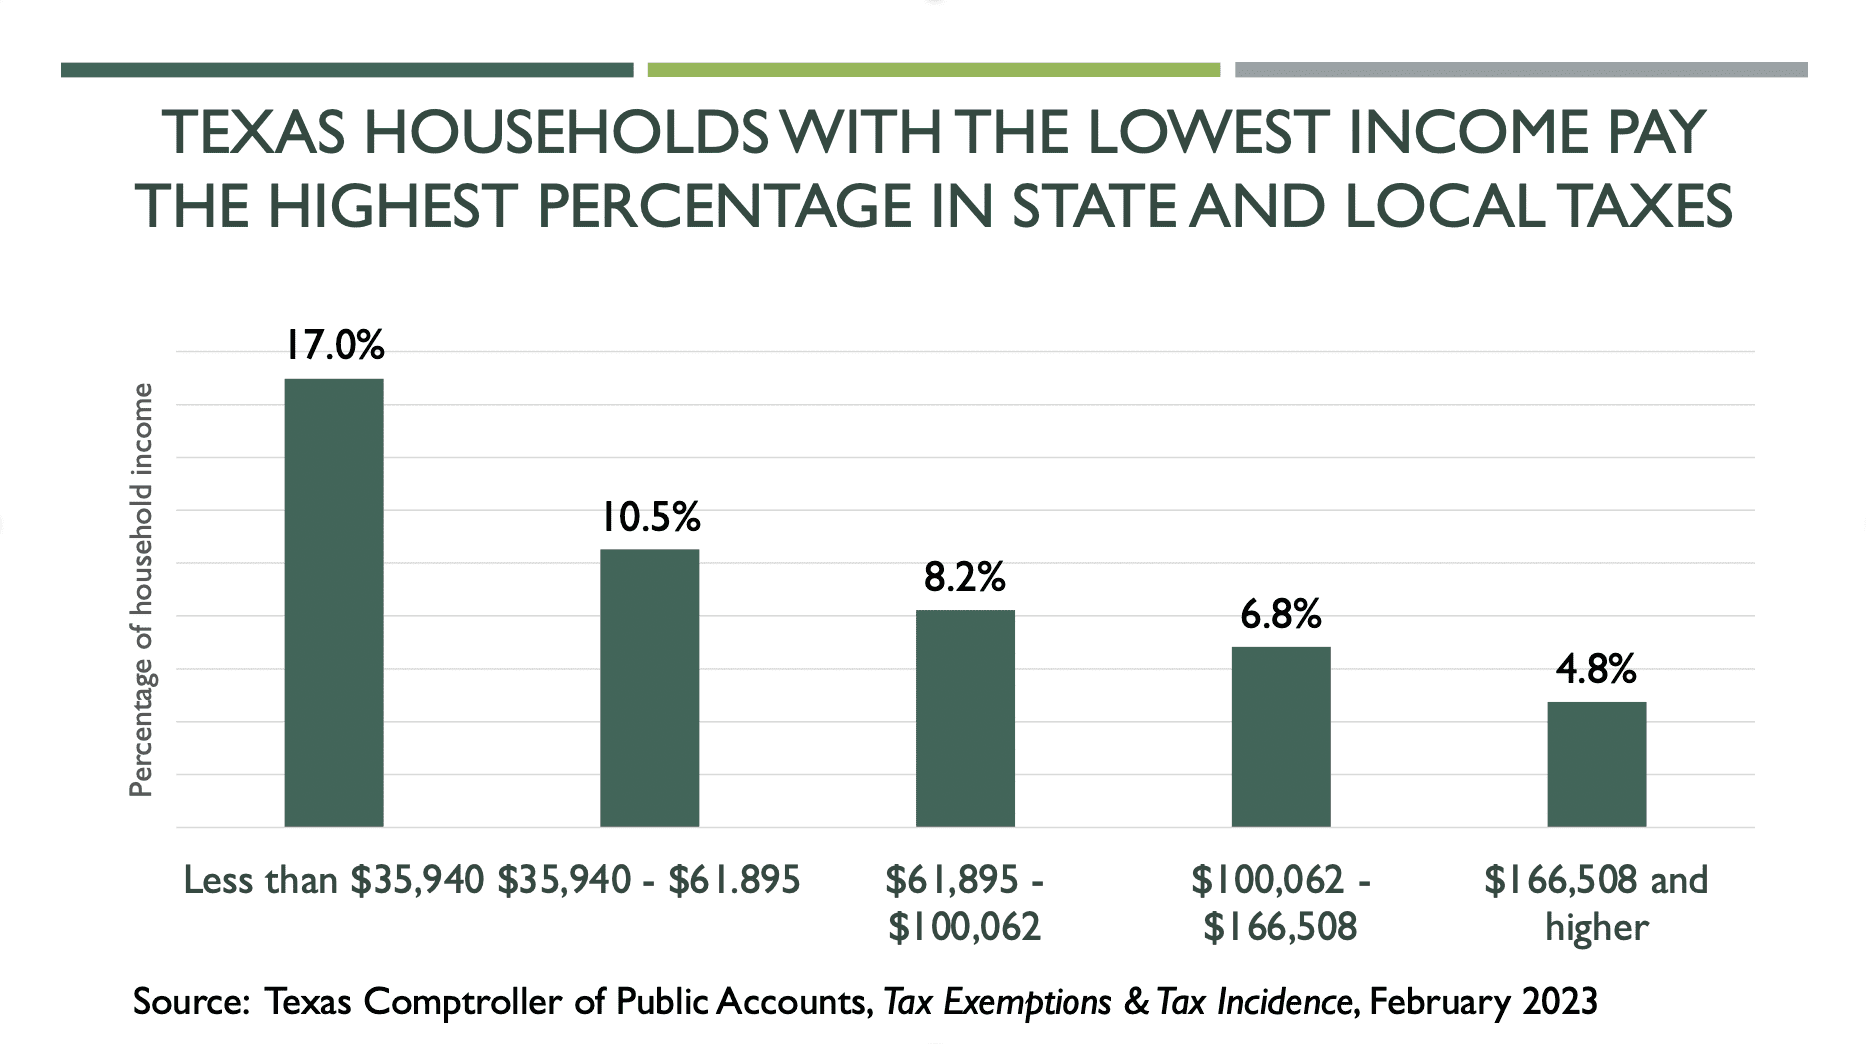
One way to judge the fairness of a tax system is to compare the percentage of income that different households pay in taxes. The comptroller’s study ranks Texas households according to income, from highest to lowest, then combines them into five groups (called “quintiles”), each of which contains the same number of households. In a state with a fair tax system, the taxes that each income group paid require a similar percentage of household income. However, in Texas, the households with the lowest incomes pay the highest percentage of their income in taxes and vice versa.
The graph below, derived from the information in the Comptroller’s report, shows the range of incomes of households in each group and the average percentage of total household income paid in state and local taxes. Each group contains 20% (2.25 million) of all Texas households. The graph reveals that households with income less than $35,940 pay 3.5 times more in taxes as a percentage of income than households with incomes over $166,508.
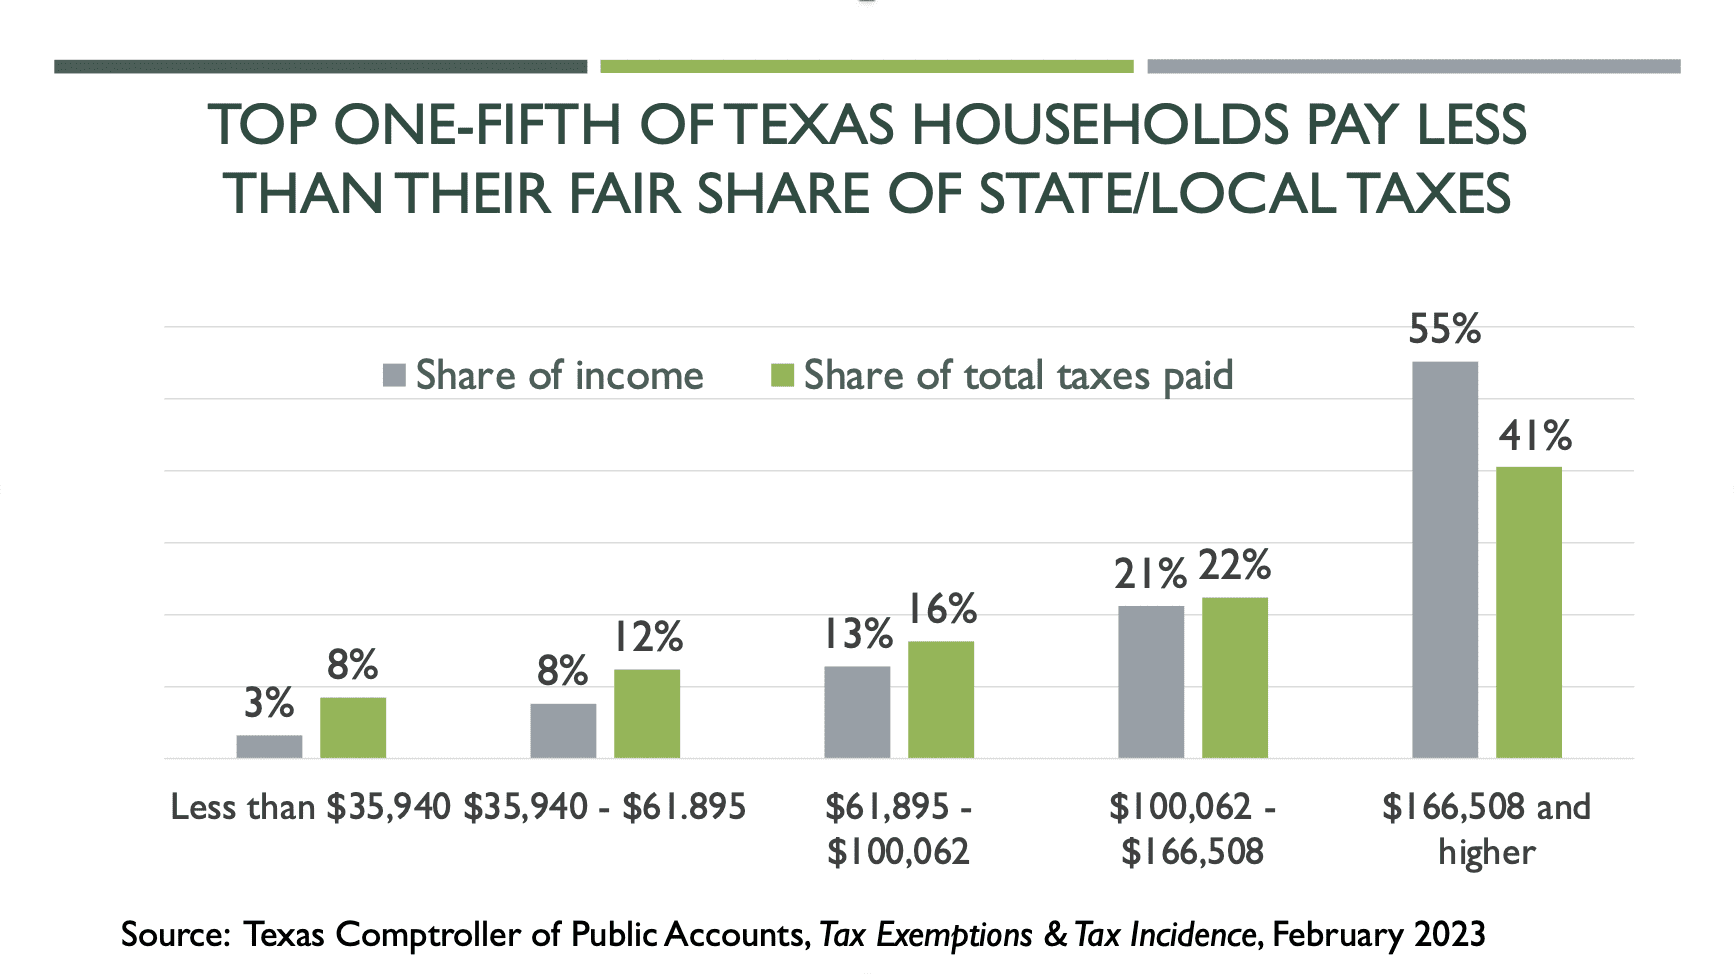
Another way to measure the fairness of a tax system is to compare the income received by households in each income group to the taxes paid by these households. The graph shows that, for each of the four income groups (80% of Texas households) earning less than $166,508 per year, the share of taxes paid by that group is higher than the share of income received by households in that group. This disparity enables the top 20% of Texas earners to pay a much smaller share of taxes than the share of income they receive.
Which Tax Is Fairer, Sales Tax or Property Tax?
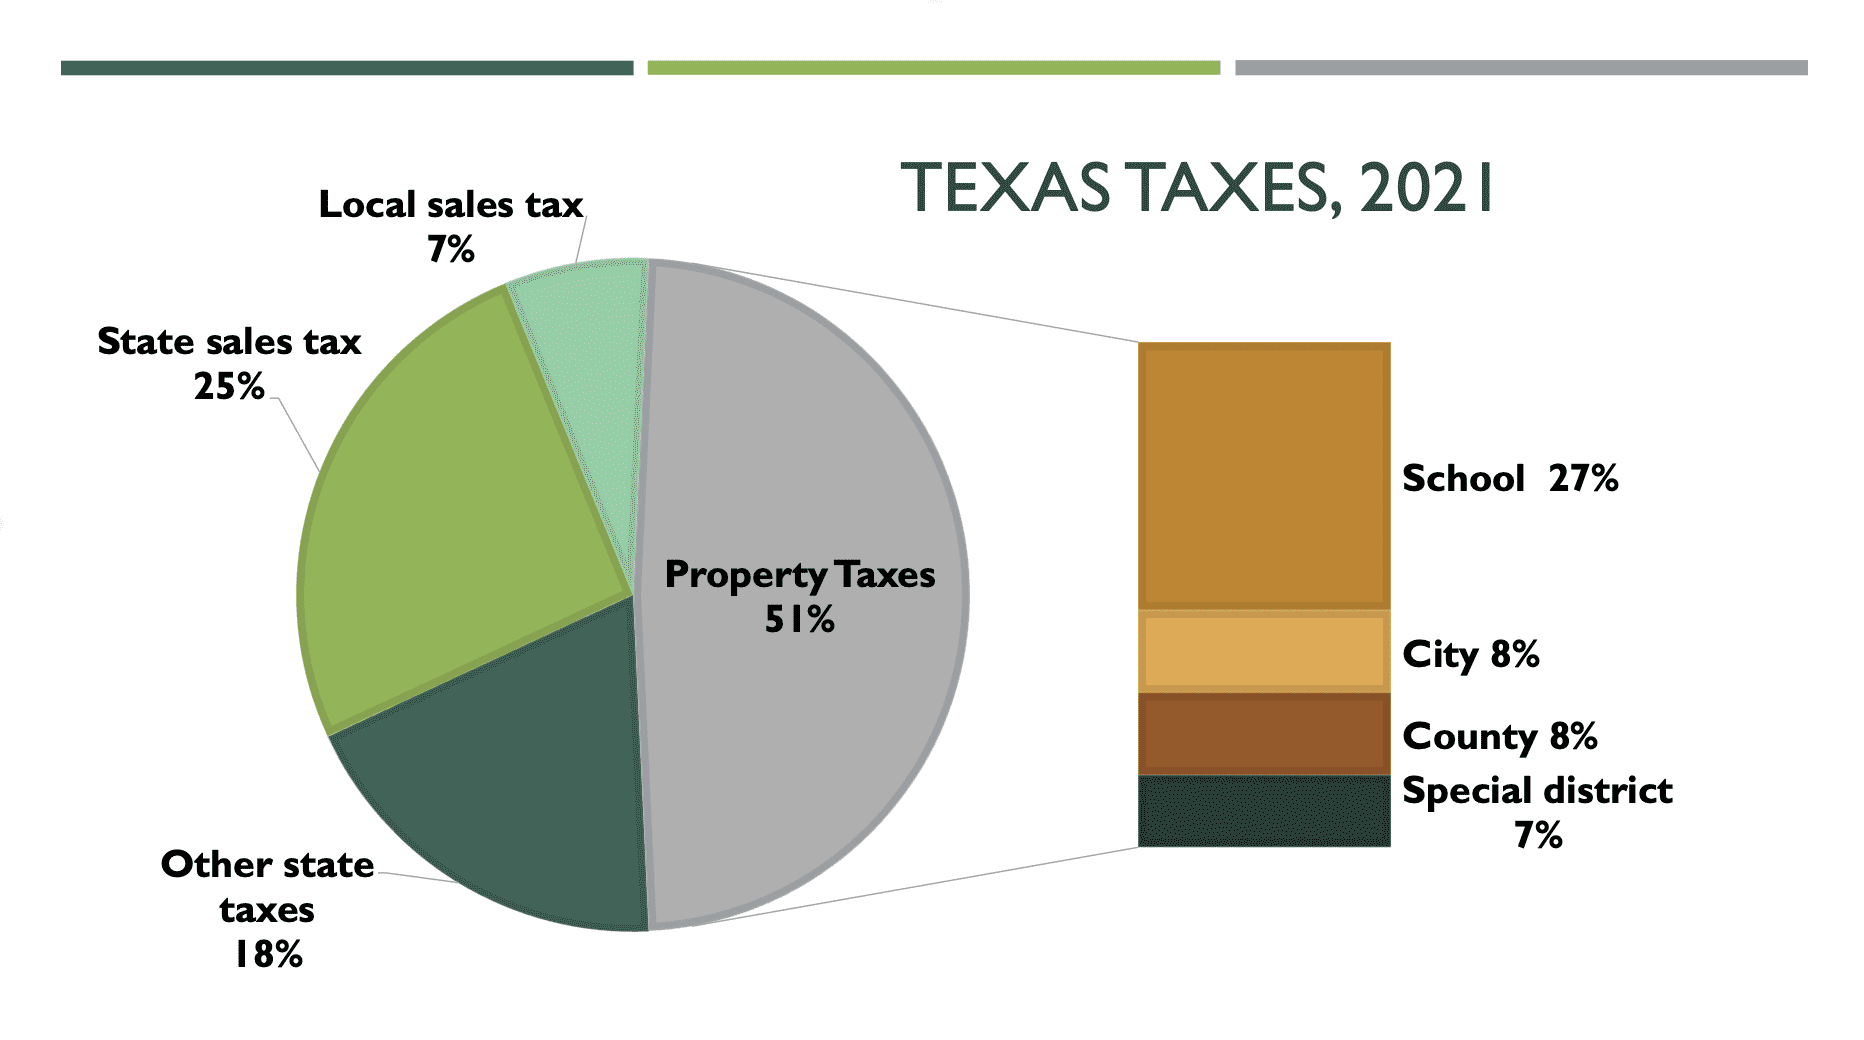
Two taxes account for more than 80% of all taxes paid by Texans. Property taxes — including those supporting public schools, cities, counties, and special districts such as community colleges — account for one-half of all taxes paid. Sales taxes, including both the 6.25% state sales tax and local sales taxes of up to an additional 2%, account for another one-third.
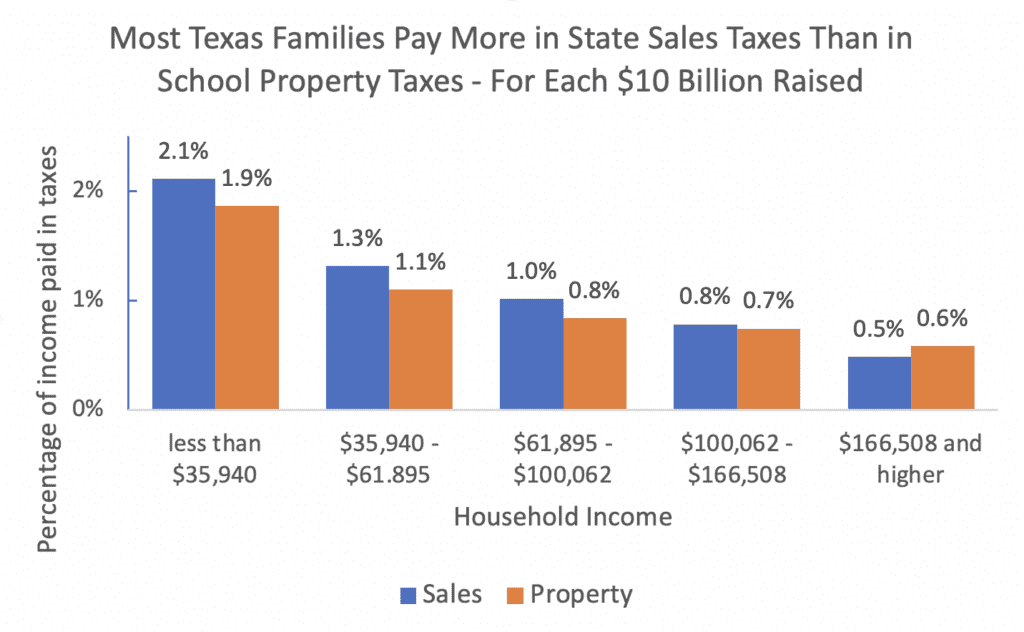
These major taxes affect families at different income levels in different ways. This chart shows how families are affected by $10 billion in state sales taxes compared to the same amount in school property taxes.
Conclusion
The Texas tax system remains unfair since those who can pay more in taxes as a percentage of income do not pay more. Without a fair and adequate tax system, the state will be unable to produce long-term support for necessary investments in schools, public safety, roads, and other public services.
The Texas Exemptions and Tax Incidence report is available here.
View this blog as a PDF here.
*Per Section 403.0141 of the Texas Government Code, incidence analysis is conducted for the school property tax and any taxes that generate more than 2.5% of state tax revenue in the previous fiscal year. More information here.