Learn more about AANHPI Texans from our data brief here.
We celebrate Asian American, Native Hawaiian, and Pacific Islander (AANHPI) Texans this May during AANHPI Heritage Month. It is estimated that over 1.8 million Asian people and about 83,000 Native Hawaiian and Pacific Islander people live in Texas (that includes multiracial people). By 2050, it is estimated there will be over 5.7 million non-Hispanic Asian people living in Texas, which will account for 12% of the Texas population. Overall, Texas currently has the third largest AANHPI population in the United States, after California and New York.
AANHPI Texans Are Diverse
Asian and Pacific Islander Texans comprise 7% of our state’s population. When looking at the Asian population (alone or in combination with other races) in Texas, the largest estimated populations are:
- 481,674 Asian Indian,
- 311,597 Vietnamese,
- 255,147 Chinese (except Taiwanese),
- 206,536 Filipino,
- 111,701 Korean,
- and 91,756 Pakistani Texans living in our state.
When looking at the Native Hawaiian and Pacific Islander population (alone or in combination with other races), there are an estimated:
- 20,180 Native Hawaiian,
- 13,692 Chamorro,
- 8,826 Samoan,
- and 2,809 Tongan people living in our state.
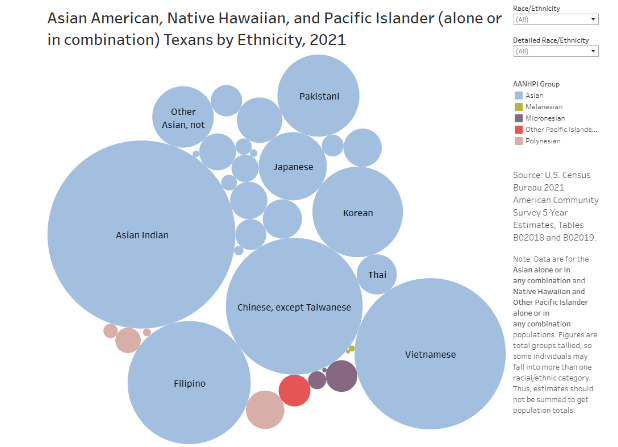
Source: Every Texan analysis of 2021 American Community Survey 5-Year Estimates, Tables B02018 and B02019.
The median age of the Asian alone population in Texas is 36.1 years. The median age of the Native Hawaiian or Pacific Islander alone population in Texas is 33.5 years.
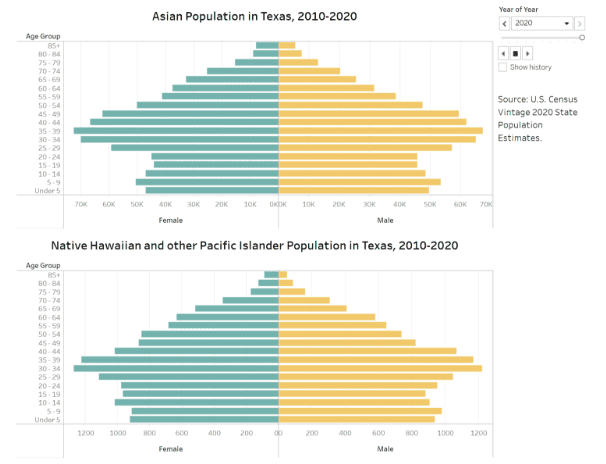
Source: Every Texan analysis of U.S. Census Bureau Vintage 2020 State Population Estimates.
The counties with the largest Asian (alone or in combination with other races) populations in Texas are Harris (376,097), Dallas (192,132), Collin (186,239), Fort Bend (182,776), and Tarrant (138,647) counties.
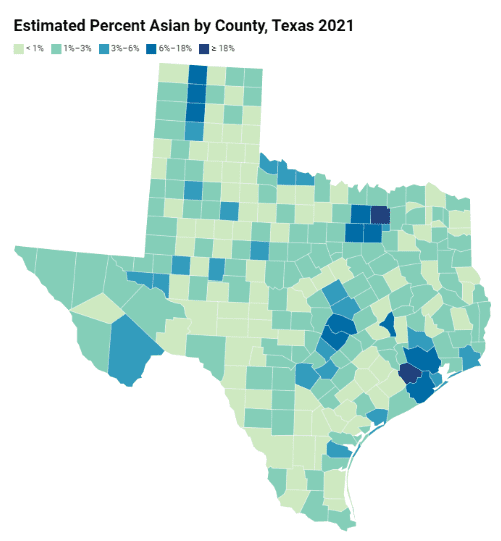
Every Texan analysis of U.S. Census Bureau 2021 American Community Survey 5-Year Estimates, Tables B02011 and B01003. Note: Data is for the Asian alone or in combination with one or more other races population.
The counties with the largest estimated Native Hawaiian or Pacific Islander (alone or in combination with other races) populations are Harris (8,529, ±979), Bexar (7,779, ±1,032), Tarrant (6,825, ±580), Dallas (4,656, ±629), and Bell (4,380, ±572) counties.
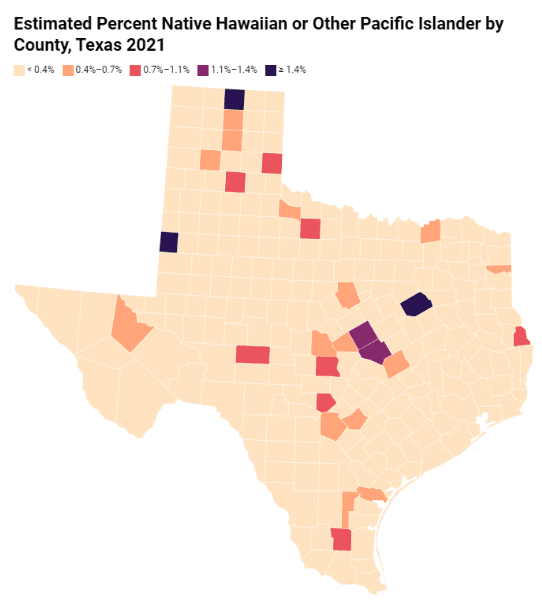
Source: Every Texan analysis of U.S. Census Bureau 2021 American Community Survey 5-Year Estimates, Tables B02012 and B01003. Note: Data is for the Native Hawaiian or Pacific Islander alone or in combination with one or more other races population.
Data Disaggregation Is An Important Policy Priority
Data disaggregation, or the way in which data are collected and reported, is an important public policy priority. Asian, Native Hawaiian, and Pacific Islander people are commonly grouped together into one racial category by federal and state agencies reporting data, but it is important to acknowledge that AANHPI people are not a monolith and have diverse cultures and lived experiences. Grouping together people with such diverse experiences and identities can be harmful and hide disparities within AANHPI populations. Unfortunately, federal and state agencies are not currently required to report detailed disaggregated data by ethnicity for AANHPI people. This is problematic because grouping all AANHPI people together obscures and leaves out the experiences of different communities. For example, the average poverty rate for AANHPI Texans is 9%, while the poverty rate for Native Hawaiian and other Pacific Islander (NHPI) Texans is 16%. However, when the data is broken out by specific ethnic groups, we can see that Fijian, Bhutanese, Burmese, Tongan, and several other groups have poverty rates higher than the overall Asian and NHPI averages.
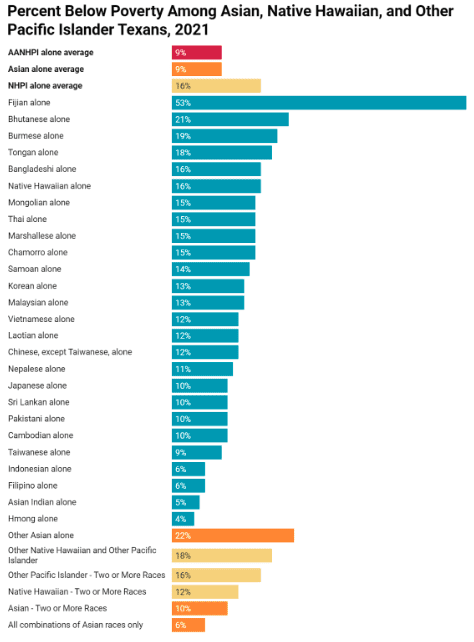
Source: Every Texan analysis of 2021 American Community Survey 5-Year Estimates PUMS.
Here’s another example of how data disaggregation can paint a more complete picture. This bar chart shows that 60% of Asian Texans and 27% of NHPI Texans 25 years and older have a Bachelor’s degree or higher.
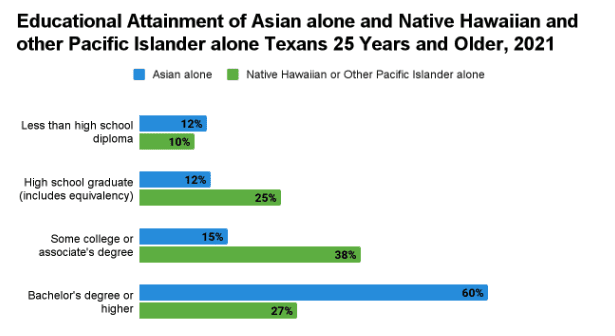
Source: Every Texan analysis of 2021 American Community Survey 5-Year Estimates PUMS.
However, when the data is further disaggregated by ethnicity, we can see that several groups have much lower percentages of people with a Bachelor’s degree or higher than the Asian and NHPI overall averages. With this information, policymakers and community leaders can create targeted plans to support the communities in most need of resources and support.
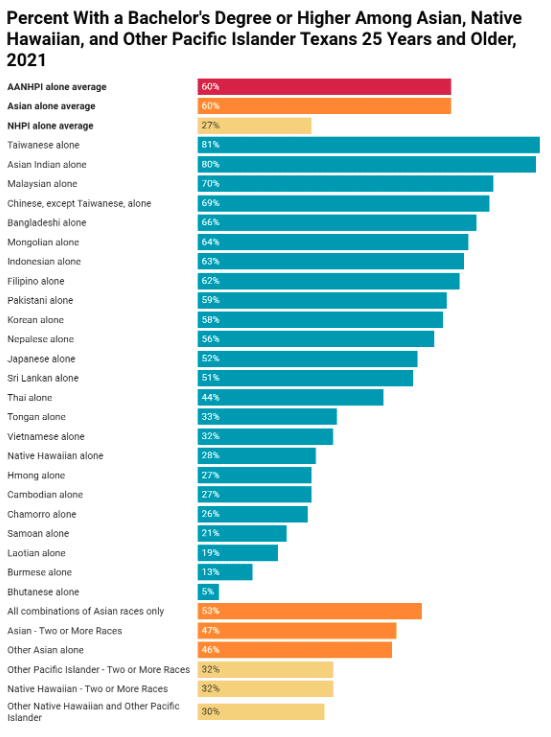
Source: Every Texan analysis of 2021 American Community Survey 5-Year Estimates PUMS. Note: The Fijian alone and Marshallese alone categories were not included due to low population counts.
Improved data collection and reporting methods would have positive impacts for other communities as well, such as Middle Eastern and North African and Indigenous communities. The U.S. Office of Management and Budget (OMB) is currently considering revising the federal standards for data on race and ethnicity (Statistical Policy Directive No. 15). Last updated in 1997, a revision of these standards would shape how agencies collect and report racial and ethnic data, improve the administration of government programs, and enforce civil rights. The National Network for Arab American Communities (NNAAC) is advocating for the requirement that all federal agencies collect, report, and utilize detailed data on race and ethnicity through a combined question that includes a “Middle Eastern or North African” response option. It is important that MENA communities are accurately counted in the 2030 Census. You can take action by asking the OMB to add a Middle Eastern or North African response category and a combined race/ethnicity question in their final revision of Directive 15 via NNAAC’s action center.
We must disaggregate data with a purpose. When we disaggregate data, we can reveal information about which groups have better outcomes than other groups, try to understand why, and figure out how to give all people the best chance to succeed in life.
Read more from The Leadership Conference on Civil and Human Rights on why data disaggregation is important for AANHPI communities.