Was Texas undercounted in the 2020 Census? This question affects us all, as population data is used to determine redistricting, funding allocation, and more. What do we know so far about Texas’ 2020 population count? In this blog Every Texan explores what analysts are saying about the accuracy of Texas numbers and what to watch for.
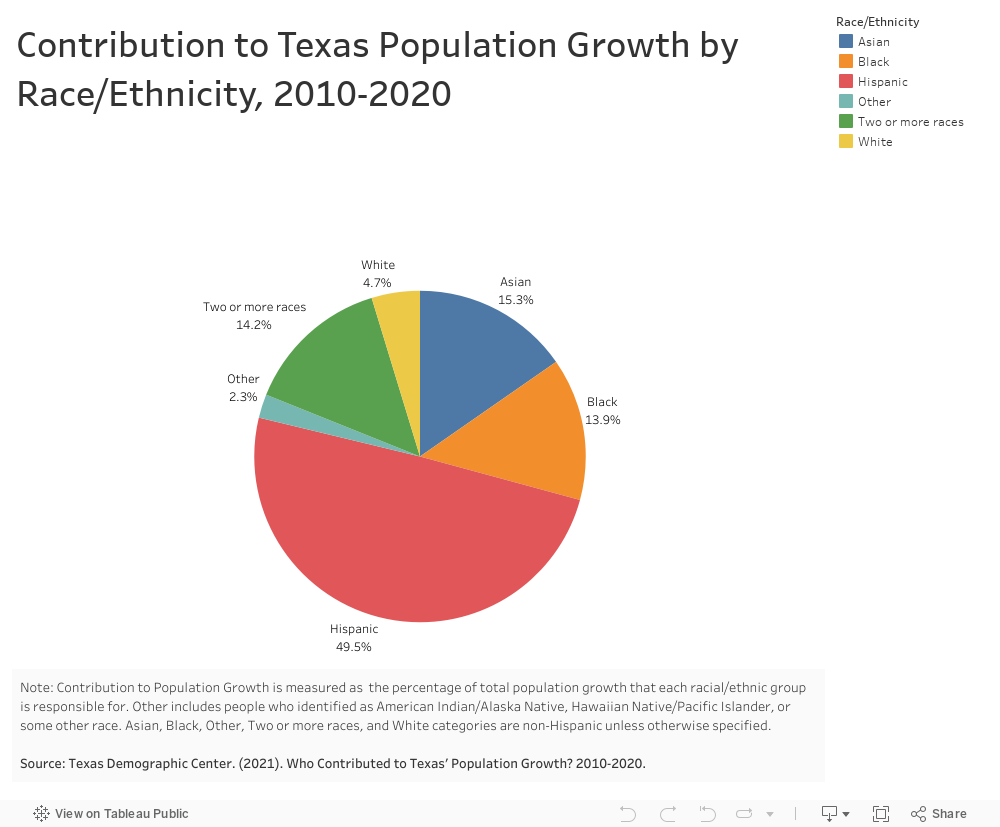
According to the 2020 Census data that is the basis for redistricting, Texas’ population grew by about four million people since 2010, and people of color made up 95% of the state’s population growth. This 16% increase in population means over 29 million people now call Texas home. Hispanic Texans made up 49.5% of the state’s growth, while Asian Texans made up 15.3%, Black Texans 13.9%, and Texans who identified as two or more races 14.2%. Put another way, between 2010 and 2020, Texas’ Hispanic population increased by 20.9%, Black population by 19.2%, and Asian population by 64.4%, compared to only a 1.6% increase for the state’s non-Hispanic white population. If not for Texas’ growth among communities of color, Texas likely would have lost a congressional seat rather than gained two.
If the growth the state saw between 2010 and 2020 continues, Texas’ Hispanic population will likely become its largest demographic group. As of 2020, Hispanic people already comprised 39.3% of Texas’ population (compared to 37.6% in 2010), while non-Hispanic white people made up 39.7% of the state’s population, a decrease from 45.3% in 2010. Census data also showed that Black people make up 12.2% (compared to 11.8% in 2010) and Asian people make up 5.4% (compared to 3.8% in 2010) of Texas’ population. Similar trends can be seen nationally — the U.S. non-Hispanic white population decreased by 8.6%, now making up 57.8% of the population compared to 63.7% in 2010, while the Hispanic population increased by 23%, now making up 18.7% of the U.S. population compared to 16.3% in 2010. In other words, about one in every five people in the United States are Hispanic, and two in five Texans are Hispanic.
Census data has highlighted explosive population growth for cities and counties as well. For example, Hays County was the fastest-growing county in the state, increasing in population by 53.44% between 2010 and 2020, while Austin-Round Rock was the fastest-growing metro area with a 33.04% increase between 2010 and 2020. Three out of ten of the nation’s largest cities are in Texas. Furthermore, Fort Bend County is among the top ten counties in the country with the highest diversity index (an index which measures the likelihood that two people chosen at random will be of different racial and ethnic groups). Overall, Texas experienced growth in urban and suburban areas and a decrease in population in rural areas, painting a much different picture of the state than in the past.
Despite urban growth, highly diverse and densely populated cities and regions are still at risk of undercounting. Census data shows that El Paso’s measured population increased by 8%, the slowest growth rate the county has had since 1940, while Houston’s population increased by 9.8%. Areas under suspicion of undercounting include El Paso, Rio Grande Valley, Dallas (some say an estimated 40% of Dallas’ population was uncounted), and Houston. Communities can look out for potential undercount in their area by comparing against:
- Previously estimated American Community Survey 5-year trends;
- Voter registration patterns;
- Tax revenue;
- Birth and death records (especially for subgroups);
- And consulting with local count advocates.
Per MALDEF’s Texas Latino Redistricting Task Force, counties that are majority-Latino, like South Texas and the Rio Grande Valley, were more likely to have a 2020 Census count below previous American Community Survey’s 2015-2019 estimates, mirroring early warnings from local organizations during the 2020 data collection period that the area may be undercounted.
Areas may be undercounted due to a variety of reasons such as:
- Language barriers;
- Fear of immigration tracking;
- Lack of mailable addresses in colonias and rural communities;
- And challenges from the COVID-19 pandemic that disproportionately affected people of color, low-income people, and immigrants — the people who, alongside children, will be most impacted by an undercount.
Despite population growth, data indicates that the 2020 Census had a higher net undercount of children than it did in 2010. According to a new report by Dr. Bill O’Hare, nationally there was a net undercount of over 1.5 million children ages 0-17 in 2020 (compared to an undercount of 1.3 million children in 2010), an increase from 1.7% undercounted in 2010 to 2.1% in 2020. Hispanic children in particular had a higher net undercount rate of 4.4% in 2020 (compared to 2.1% in 2010), likely as a result of the anti-immigration rhetoric of the Trump administration that had a chilling effect on Census participation, as well as systemic racism resulting in Hispanic children being more likely to live in hard-to-count communities. This could have huge implications if applied to Texas, where Hispanic families are leading population growth in terms of total numbers.
It is also likely that Black children were undercounted in 2020. In 2010, there was a 2.5% net undercount of Black children (the highest net undercount of any racial/ethnic group in 2010). Until the Census Bureau releases the modified race file for the 2020 Census, we cannot know for certain whether the net undercount of Black children in 2020 is comparable to 2010. However, data suggests that there may be a significant undercount. For example, 48% of Black children lived in hard-to-count communities in 2020 (compared to 9% of white children) as a result of systemic racism and residential segregation.
Texas may be undercounted specifically in its Hispanic population for several reasons. While states like Minnesota and California started preparing for the 2020 Census well ahead of time, Texas did not take action until September 2020, after the count had already begun. Unsurprisingly, Texas’ self-response rate ended up below the national average of 67% at 62.8%, ranking Texas at 38th in the nation for self-response rates. Texas, together with other Republican-led states with large Hispanic populations like Arizona and Florida, took little official action to promote the Census and ended up with one fewer congressional seat than initially predicted. The COVID-19 pandemic further hampered data collection efforts. The inaction of state policymakers, the Trump administration’s attempt to put a citizenship question on the 2020 Census, and other factors (such as a lack of translated resources) related to systemic racism contributed to the undercount of Hispanic communities, as well as other communities that face language barriers and immigration fears, such as Asian communities. It is also highly likely that Black individuals were undercounted in 2020 (national research on these statistics is underway).
These potential undercounts have very real consequences for equitable program funding and political representation. It is crucial that policymakers redistrict in good faith using existing 2020 data to provide equitable representation for all Texas communities, as well as invest in a more equitable count leading up to 2030 so that our political boundaries accurately represent Texans of all backgrounds, and that our communities receive fair representation.
Read more about our community-led work in 2020 with Texas Counts here.
Read our blog on how Texas needs bold action here.
Thanks to Research & Data Intern Kimberly Clarida for contributing research and data analysis.